Detect Small Objects with supervision.InferenceSlicer
![]()

![]()
This cookbook shows how to use Slicing Aided Hyper Inference (SAHI) for small object detection with supervision.

Click the Open in Colab button to run the cookbook on Google Colab.
Before you start
You'll need:
- A free Roboflow account. Don't have one? Create one here.
- An API key from Roboflow. Need help getting one? Learn more here.
Install required packages
Let's install the dependencies for this project. Here's a list of what
inference: a package by Roboflow for easy deployment of computer vision models.supervision: a package by Roboflow that provides utilities for building and managing computer vision applications.
%pip install inference supervision jupyter_compare_view
Crowd counting with Computer Vision
How would you go about solving the problem of counting people in crowds? After some tests, I found that the best approach is to detect people’s heads. Other body parts are likely occluded by other people, but heads are usually exposed, especially in aerial or high-level shots.
Using an Open-Source Public Model for People Detection
Detecting people (or their heads) is a common problem that has been addressed by many researchers in the past. In this project, we’ll use an open-source public dataset and a fine-tuned model to perform inference on images.

Some details about the project "people_counterv0 Computer Vision Project":
- Dataset of 4,574 images
- mAP=49.2% / Precision=74.5% / Recall=39.2
- Model: Roboflow 2.0 Object Detection (fast)
- Checkpoint: COCOv6n
- Created by: SIT
Imports
Run the code below to download to load the modules necessarry for this cookbook
import math
import os
import time
import cv2
import matplotlib.pyplot as plt
import numpy as np
import supervision as sv
from inference import get_model
from jupyter_compare_view import compare
Download Image
# Download the image
!wget -O human_tower.jpg "https://upload.wikimedia.org/wikipedia/commons/thumb/d/d0/4_de_8_amb_l%27agulla_carregat_Castellers_de_Barcelona_%2821937141066%29.jpg/2560px-4_de_8_amb_l%27agulla_carregat_Castellers_de_Barcelona_%2821937141066%29.jpg"
image = cv2.imread("human_tower.jpg")
image_wh = (image.shape[1], image.shape[0])
print(f"Image shape: {image_wh[0]}w x {image_wh[1]}h")
sv.plot_image(image)
Image shape: 2560w x 1696h

Let's try our model's performance
Before we dive into the SAHI technique for small object detection, it’s useful to see how a fine-tuned model performs with the image as is—without any pre-processing or slicing. The goal is to understand when the model starts to fail so that we can progressively move towards an efficient slicing strategy.
Let’s run the model!
MODEL_ID = "people_counterv0/1"
API_KEY = "" # Retrieve your API key: https://docs.roboflow.com/api-reference/authentication
# If using Google Colab
#from google.colab import userdata
#API_KEY = userdata.get("ROBOFLOW_API_KEY") #Retrieve your API key: https://docs.roboflow.com/api-reference/authentication
model = get_model(MODEL_ID, api_key=API_KEY)
# Run inference
results = model.infer(image, model_id=MODEL_ID)
detections = sv.Detections.from_inference(results[0])
print(f"Found {len(detections)} people")
bbox_annotator = sv.BoxAnnotator(
color=sv.ColorPalette.DEFAULT.colors[6],
thickness=2
)
# Annotate our image with detections.
image_no_sahi = bbox_annotator.annotate(scene=image.copy(), detections=detections)
sv.plot_image(image_no_sahi)
UserWarning: Specified provider 'CUDAExecutionProvider' is not in available provider names.Available providers: 'CPUExecutionProvider' UserWarning: Specified provider 'OpenVINOExecutionProvider' is not in available provider names.Available providers: 'CPUExecutionProvider'
Found 185 people

Compare source image with no SAHI detected Image
resize_image = (600, 400)
bgr_image = cv2.cvtColor(image, cv2.COLOR_RGB2BGR)
bgr_image_no_sahi = cv2.cvtColor(image_no_sahi, cv2.COLOR_RGB2BGR)
# Resize the images for better comparison
bgr_image = cv2.resize(bgr_image, resize_image)
bgr_image_no_sahi = cv2.resize(bgr_image_no_sahi, resize_image)
compare(bgr_image, bgr_image_no_sahi, start_mode="horizontal", start_slider_pos=0.5)
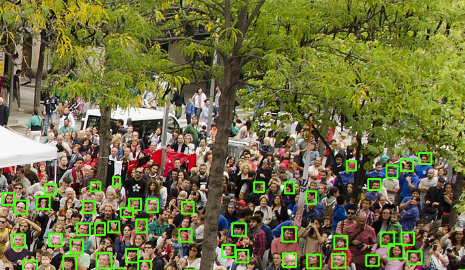
The model shows strong performance in detecting people in the lower half of the image, but it struggles to accurately predict boxes in the upper half. This suggests two key insights: first, the model is proficient at identifying people’s heads from various angles, and second, using SAHI could effectively address the detection challenges in the upper portion of the image. Now, it’s time to try SAHI!
Using sv.InferenceSlicer for small object detection
The InferenceSlicer is a utility for performing slicing-based inference on large images, particularly useful for detecting small objects. It divides a large image into smaller slices, runs inference on each slice, and then merges the results to form the final detections for the entire image. This method, known as Slicing Adaptive Hyper Inference (SAHI), improves detection accuracy by focusing on smaller regions where small objects might be missed in a full-scale inference.
Key Features:
- Slicing Strategy: Divides an image into smaller slices with configurable sizes and overlaps.
- Overlap Management: Supports different overlap strategies (ratio-based or pixel-based) to ensure smooth transitions between slices.
- Detection Merging: Merges detections from all slices using Non-Maximum Suppression (NMS) or Non-Maximum Merging (NMM) to handle overlapping detections.
- Parallel Processing: Utilizes multi-threading to perform inference on slices concurrently, enhancing speed.
- Custom Inference Callback: Allows you to define their own inference function for flexibility in integrating various detection models.

SAHI can be viewed as a framework designed to tackle the challenge of small object detection. The InferenceSlicer class from the supervision library provides an implementation of SAHI, allowing you to easily use it as follows:
import cv2
import supervision as sv
from ultralytics import YOLO
image = cv2.imread(SOURCE_IMAGE_PATH)
model = YOLO(...)
def callback(image_slice: np.ndarray) -> sv.Detections:
result = model(image_slice)[0]
return sv.Detections.from_ultralytics(result)
slicer = sv.InferenceSlicer(
# A function that performs inference on a given image slice and returns detections.
callback=callback,
# Strategy for filtering or merging overlapping detections in slices.
overlap_filter=sv.OverlapFilter.NON_MAX_SUPPRESSION,
# Dimensions of each slice measured in pixels. The tuple should be in the format (width, height).
slice_wh=(100, 100)
)
detections = slicer(image)
Check the documentation of sv.InferenceSlicer here.
Slicing our image with supervision
Let’s begin by visualizing how these tiles would appear on our image. Let's start with a small set of 2x2 tiles, with a zero overlap both vertically (height) and horizontally (width) between the tiles. The final values of these parameters will ultimately depend on your use case, so trial and error is encouraged!
Some of the methods below are for visualizing the tiles and overlapping. You'll only need the calculate_tile_size method in your application to calculate the size of the tiles.
Utility functions for visualizing tiles
def tile_image(image_shape: tuple[int, int], slice_wh: tuple[int, int], overlap_wh: tuple[float, float])-> np.ndarray:
"""
Computes the coordinates and dimensions of tiles for an image with specified slicing and overlap parameters.
"""
offsets = sv.InferenceSlicer._generate_offset(
resolution_wh=image_shape,
slice_wh=slice_wh,
overlap_ratio_wh=None,
overlap_wh=overlap_wh
)
offsets = np.ceil(offsets).astype(int)
return offsets
def draw_transparent_tiles(scene: np.ndarray, x: int, y: int, w:int, h:int) -> np.ndarray:
"""
Draws a transparent tile with an optional index label on the given scene.
"""
alpha=0.15
# Generate a mask for the tile
rectangle = np.zeros((h, w, 3), dtype=np.uint8)
rectangle.fill(255)
rect = sv.Rect(x=x, y=y, width=w, height=h)
overlay_image = sv.draw_image(scene=scene.copy(), image=rectangle, opacity=alpha, rect=rect)
# Draw a border around the edge of the mask
border_color = sv.Color.BLACK
border_thickness=2
overlay_image = sv.draw_rectangle(
scene=overlay_image,
rect=sv.Rect(x=x, y=y, width=w, height=h),
color=border_color,
thickness=border_thickness
)
return overlay_image
def draw_tiles(scene: np.ndarray, offsets):
"""
Draws transparent tiles on a scene based on the given offsets.
"""
tiled_image = scene.copy()
for index, offset in enumerate(offsets):
x = offset[0]
y = offset[1]
width = offset[2] - x
height = offset[3] - y
tiled_image = draw_transparent_tiles(scene=tiled_image, x=x, y=y, w=width, h=height)
return tiled_image
def print_offsets(offsets):
for index, (x1, y1, x2, y2) in enumerate(offsets, 1):
w, h = x2 - x1, y2 - y1
print(f"Tile {index + 1}")
print(f" w={w}, h={h}, x1={x1}, y1={y1}, x2={x2}, y2={y2}, area={w*h}")
Calculate Tile Size
Important: As of supervision==0.23.0 you need to provide the tile size manually. You can the function below to calculate it.
The calculate_tile_size function determines the desired dimentions of the tiles when dividing an image into a grid by considering the following parameters:
- Image dimensions: The width and height of the image, specified as (width, height), e.g., (1024, 768).
- Grid layout: The number of tiles, specified as (rows, columns), e.g., (2, 2).
- Overlap: The percentage of overlap between adjacent tiles, specified separately for horizontal and vertical overlap, e.g., (0.1, 0.1).
It returns a tuple containing:
- Tile size: A tuple representing the width and height of each tile, including the overlap (overlap_wh) between adjacent tiles.
- Overlap size: A tuple representing the overlap between tiles in pixels (overlap_wh). If the overlap ratio is set to (0.0, 0.0), this value will be (0, 0), indicating no overlap.
For example:
>>> image_shape = (1024, 768)
>>> tiles = (4, 4)
>>> overlap_ratio_wh = (0.15, 0.15)
>>> calculate_tile_size(image_shape, tiles, overlap_ratio_wh)
((295, 221), (39, 29))
def calculate_tile_size(image_shape: tuple[int, int], tiles: tuple[int, int], overlap_ratio_wh: tuple[float, float] = (0.0, 0.0)):
"""
Calculate the size of the tiles based on the image shape, the number of tiles, and the overlap ratio.
Parameters:
----------
image_shape : tuple[int, int]
The dimensions of the image as (width, height).
tiles : tuple[int, int]
The tiling strategy defined as (rows, columns), specifying the number of tiles along the height and width of the image.
overlap_ratio_wh : tuple[float, float], optional
The overlap ratio for width and height as (overlap_ratio_w, overlap_ratio_h). This defines the fraction of overlap between adjacent tiles. Default is (0.0, 0.0), meaning no overlap.
Returns:
-------
tuple[tuple[int, int], tuple[int, int]]
A tuple containing:
- The size of each tile as (tile_width, tile_height), accounting for overlap.
- The overlap dimensions as (overlap_width, overlap_height).
Example:
-------
>>> image_shape = (1024, 768)
>>> tiles = (4, 4)
>>> overlap_ratio_wh = (0.15, 0.15)
>>> calculate_tile_size(image_shape, tiles, overlap_ratio_wh)
((295, 221), (39, 29))
"""
w, h = image_shape
rows, columns = tiles
tile_width = (w / columns)
tile_height = (h / rows)
overlap_w, overlap_h = overlap_ratio_wh
tile_width = math.ceil(w / columns * (1 + overlap_w))
tile_height = math.ceil(h / rows * (1 + overlap_h))
overlap_wh = (math.ceil(tile_width * overlap_w), math.ceil(tile_height * overlap_h))
return (tile_width, tile_height), overlap_wh
Visualizing the Image Tiles
tiles = (2,2)
overlap_ratio_wh = (0.0, 0.0) # The overlap between tiles
slice_wh, overlap_wh = calculate_tile_size(image_wh, tiles, overlap_ratio_wh)
offsets = tile_image(image_wh, slice_wh, overlap_wh)
print(f"Image shape: {image_wh[0]}w x {image_wh[1]}h")
print(f"Tiles: {tiles}")
print(f"Tile size: {slice_wh[0]}w x {image_wh[1]}")
print(f"Generated {len(offsets)} tiles. These are the calculated dimensions")
print_offsets(offsets)
tiled_image = draw_tiles(scene=image.copy(), offsets=offsets)
sv.plot_image(tiled_image)
Image shape: 2560w x 1696h Tiles: (2, 2) Tile size: 1280w x 1696 Generated 4 tiles. These are the calculated dimensions Tile 2 w=1280, h=848, x1=0, y1=0, x2=1280, y2=848, area=1085440 Tile 3 w=1280, h=848, x1=1280, y1=0, x2=2560, y2=848, area=1085440 Tile 4 w=1280, h=848, x1=0, y1=848, x2=1280, y2=1696, area=1085440 Tile 5 w=1280, h=848, x1=1280, y1=848, x2=2560, y2=1696, area=1085440

You can see that the image has been sliced into four different tiles. Next, each tile will be independently processed by the model, and supervision will merge all the predictions into a coherent set of detections. Notice that we're not using overlapping in at this time (more on that later).
Run Inference on a Sliced Image With supervision
Running inference on slices of your image is easy with the class InferenceSlicer from Supervision. This API from Roboflow divides a larger image into smaller slices, performs inference on each slice, and then merges the detections into a single detections object.
def callback(image_slice: np.ndarray) -> sv.Detections:
result = get_model(model_id=MODEL_ID, api_key=API_KEY).infer(image_slice )[0]
return sv.Detections.from_inference(result)
tiles = (2,2) # The number of tiles you want
overlap_ratio_wh = (0.0, 0.0) # The overlap between tiles
slice_wh, overlap_wh = calculate_tile_size(image_wh, tiles, overlap_ratio_wh)
offsets = tile_image(image_wh, slice_wh, overlap_wh)
slicer = sv.InferenceSlicer(
callback=callback,
slice_wh=slice_wh,
overlap_ratio_wh=None,
overlap_wh=overlap_wh,
thread_workers=4
)
detections = slicer(image)
print(f"Image shape: {image_wh[0]}w x {image_wh[1]}h")
print(f"Tiles: {tiles}")
print(f"Tile size: {slice_wh[0]}w x {image_wh[1]}")
print(f"Overlap: {overlap_wh[0]}w x {overlap_wh[1]}h. Ratio {overlap_ratio_wh}")
print(f"Found {len(detections)} people")
tiled_image_2x2 = draw_tiles(scene=image.copy(), offsets=offsets)
tiled_image_2x2 = bbox_annotator.annotate(scene=tiled_image_2x2, detections=detections)
sv.plot_image(image=tiled_image_2x2, size=(20, 20))
Image shape: 2560w x 1696h Tiles: (2, 2) Tile size: 1280w x 1696 Overlap: 0w x 0h. Ratio (0.0, 0.0) Found 726 people

Great! We’ve detected 726 people, up from the 185 we initially detected without image slicing. The model is still detecting people from different angles, but it continues to struggle with detecting people located in the farther parts of the plaza. It’s time to increase the number of tiles—in other words, zoom in so the model can capture more details of the small heads of people.
Increasing Tile Density: Moving to a 5x5 Grid
Now that we’ve seen improvements with a 2x2 grid, it’s time to push the model further. By increasing the number of tiles to a 5x5 grid, we effectively zoom in on the image, allowing the model to capture finer details, such as smaller and more distant features that might have been missed before. This approach will help us understand how well the model performs with even more zoomed-in images. Let’s explore how this change affects our detection accuracy and overall performance.
def callback(image_slice: np.ndarray) -> sv.Detections:
result = get_model(model_id=MODEL_ID, api_key=API_KEY).infer(image_slice )[0]
return sv.Detections.from_inference(result)
tiles = (5,5) # The number of tiles you want
overlap_ratio_wh = (0.0, 0.0) # The overlap between tiles
slice_wh, overlap_wh = calculate_tile_size(image_wh, tiles, overlap_ratio_wh)
offsets = tile_image(image_wh, slice_wh, overlap_wh)
slicer = sv.InferenceSlicer(
callback=callback,
slice_wh=slice_wh,
overlap_wh=overlap_wh,
overlap_ratio_wh=None,
thread_workers=4
)
detections = slicer(image)
print(f"Image shape: {image_wh[0]}w x {image_wh[1]}h")
print(f"Tiles: {tiles}")
print(f"Tile size: {slice_wh[0]}w x {image_wh[1]}")
print(f"Overlap: {overlap_wh[0]}w x {overlap_wh[1]}h. Ratio {overlap_ratio_wh}")
print(f"Overlap filter: {sv.OverlapFilter.NON_MAX_SUPPRESSION}")
print(f"Found {len(detections)} people")
tiled_image_5x5 = draw_tiles(scene=image.copy(), offsets=offsets)
tiled_image_5x5 = bbox_annotator.annotate(scene=tiled_image_5x5, detections=detections)
sv.plot_image(image=tiled_image_5x5, size=(20, 20),)
Image shape: 2560w x 1696h Tiles: (5, 5) Tile size: 512w x 1696 Overlap: 0w x 0h. Ratio (0.0, 0.0) Overlap filter: OverlapFilter.NON_MAX_SUPPRESSION Found 1494 people

We’ve just detected 1,494 people using a 25-tile grid (5 rows x 5 columns), a significant increase from the 726 people detected with the 4-tile (2x2) grid. However, as we increase the number of tiles, a new challenge arises: duplicate detections or missed detections along the edges of the tiles. This issue becomes evident in these examples, where overlapping or gaps between tiles lead to inaccuracies in our model’s detection.
| Example | Observations |
|---|---|
 |
False Negative, Incomplete bbox |
 |
Double detection, Incomplete bbox |
 |
Incomplete bounding box |
Improving Object Detection Near Boundaries with Overlapping
When objects, like people, appear at the edges of tiles, they might be detected twice or missed entirely if they span across two tiles. This can lead to inaccurate detection results. To solve this, we use overlapping tiles, allowing the model to see parts of adjacent tiles simultaneously. This overlap helps ensure that objects near the boundaries are fully captured, reducing duplicates and improving accuracy.
We’ll set the overlap ratio to (0.2, 0.2) on the tile’s width and height. This overlap helps ensure that objects near the boundaries are fully captured, reducing duplicates and improving accuracy.
tiles = (5,5) # The number of tiles you want
overlap_ratio_wh = (0.15, 0.15) # Ratio of overlapping, width/height
slice_wh, overlap_wh = calculate_tile_size(image_wh, tiles, overlap_ratio_wh)
offsets = tile_image(image_wh, slice_wh, overlap_wh)
slicer = sv.InferenceSlicer(
callback=callback,
overlap_filter=sv.OverlapFilter.NON_MAX_SUPPRESSION,
iou_threshold=0.1,
slice_wh=slice_wh,
overlap_ratio_wh=None,
overlap_wh=overlap_wh,
thread_workers=4
)
detections = slicer(image)
print(f"Image shape: {image_wh[0]}w x {image_wh[1]}h")
print(f"Tiles: {tiles}")
print(f"Tile size: {slice_wh[0]}w x {image_wh[1]}")
print(f"Overlap: {overlap_wh[0]}w x {overlap_wh[1]}h. Ratio {overlap_ratio_wh}")
print(f"Overlap Filter: {sv.OverlapFilter.NON_MAX_SUPPRESSION}")
print(f"Found {len(detections)} people")
tiled_image_5x5_nms = draw_tiles(scene=image.copy(), offsets=offsets)
tiled_image_5x5_nms = bbox_annotator.annotate(scene=tiled_image_5x5_nms, detections=detections)
sv.plot_image(image=tiled_image_5x5_nms, size=(20, 20))
Image shape: 2560w x 1696h Tiles: (5, 5) Tile size: 589w x 1696 Overlap: 89w x 59h. Ratio (0.15, 0.15) Overlap Filter: OverlapFilter.NON_MAX_SUPPRESSION Found 1396 people

Non-Max Supression vs Non-Max Merge
When dealing with overlapping detections, it’s essential to determine which detections represent the same object and which are unique. Non-Maximum Suppression (NMS) and Non-Maximum Merging (NMM) are two techniques commonly used to address this challenge. NMS works by eliminating redundant detections based on confidence scores, while NMM combines overlapping detections to enhance the representation of objects spanning multiple tiles. Understanding the difference between these methods helps optimize object detection, particularly near tile boundaries.
In supervision, the overlap_filter parameter allows us to specify the strategy for handling overlapping detections in slices. This parameter can take on two values:
sv.OverlapFilter.NON_MAX_SUPRESSION(default): Eliminates redundant detections by keeping the one with the highest confidence score.sv.OverlapFilter.NON_MAX_MERGE: Combines overlapping detections to create a more comprehensive representation of objects spanning multiple tiles.
It’s important to note that this method is not perfect and may require further testing and fine-tuning to achieve optimal results in various use cases. You should validate the outputs and adjust parameters as needed to handle specific scenarios effectively.
tiles = (5,5) # The number of tiles you want
overlap_ratio_wh = (0.15, 0.15) # The overlap ratio: 20% width, 20% height
slice_wh, overlap_wh = calculate_tile_size(image_wh, tiles, overlap_ratio_wh)
offsets = tile_image(image_wh, slice_wh, overlap_wh)
slicer = sv.InferenceSlicer(
callback=callback,
overlap_filter=sv.OverlapFilter.NON_MAX_MERGE,
#iou_threshold=0.1,
slice_wh=slice_wh,
overlap_ratio_wh=None,
overlap_wh=overlap_wh,
thread_workers=4
)
detections = slicer(image)
print(f"Image shape: {image_wh[0]}w x {image_wh[1]}h")
print(f"Tile size: {slice_wh[0]}w x {image_wh[1]}")
print(f"Overlap: {overlap_wh[0]}w x {overlap_wh[1]}h. Ratio {overlap_ratio_wh}")
print(f"Overlap Filter: {sv.OverlapFilter.NON_MAX_MERGE}")
print(f"Found {len(detections)} people")
tiled_image_5x5_nmm = draw_tiles(scene=image.copy(), offsets=offsets)
tiled_image_5x5_nmm = bbox_annotator.annotate(scene=tiled_image_5x5_nmm, detections=detections)
sv.plot_image(image=tiled_image_5x5_nmm, size=(20, 20))
Image shape: 2560w x 1696h Tile size: 589w x 1696 Overlap: 89w x 59h. Ratio (0.15, 0.15) Overlap Filter: OverlapFilter.NON_MAX_MERGE Found 1516 people

Compare Image with Sahi Image
resize_image = (600, 400)
bgr_image = cv2.cvtColor(image.copy(), cv2.COLOR_RGB2BGR)
tiled_image = bbox_annotator.annotate(scene=image.copy(), detections=detections)
bgr_tiled_image = cv2.cvtColor(tiled_image, cv2.COLOR_RGB2BGR)
# Resize the images for better comparison
tiled_image = cv2.resize(bgr_image, resize_image)
bgr_tiled_image = cv2.resize(bgr_tiled_image, resize_image)
compare(tiled_image, bgr_tiled_image, start_mode="horizontal", start_slider_pos=0.5)
Conclusion
In this cookbook, we’ve explored the advantages of using the SAHI technique for enhancing small object detection and the importance of experimenting with various tiling strategies to effectively zoom into images. By combining these approaches, we can improve the accuracy and reliability of object detection models, particularly in challenging scenarios where objects are small or located near the boundaries of tiles. These methods offer practical solutions to common challenges in computer vision, empowering developers to build more robust and precise detection systems.

More resources
InferenceSlicer: https://supervision.roboflow.com/detection/tools/inference_slicer/- Detect Small Objects https://supervision.roboflow.com/latest/how_to/detect_small_objects/
- What is Non-Max Merging?: https://blog.roboflow.com/non-max-merging/
- How to Detect Small Objects: A Guide https://blog.roboflow.com/detect-small-objects/
- How to Use SAHI to Detect Small Objects: https://blog.roboflow.com/how-to-use-sahi-to-detect-small-objects/
- SAHI paper: https://arxiv.org/abs/2202.06934
- C4W3L07 Nonmax Suppression, Andrew Ng: https://www.youtube.com/watch?v=VAo84c1hQX8